pg_ext_memcheck - The memory bug detector that speaks PostgreSQL
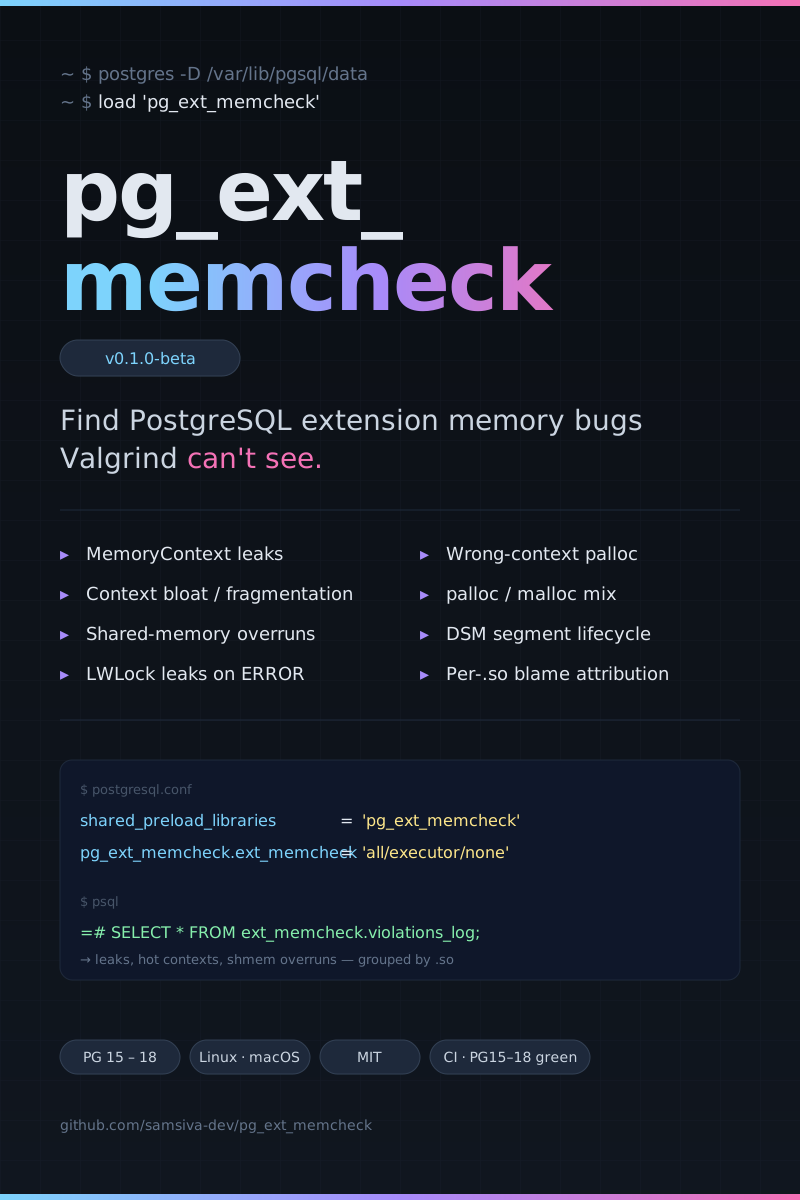
Today I'm tagging the first beta of pg_ext_memcheck — a PostgreSQL extension that finds the class of memory bugs Valgrind structurally cannot see, because they aren't bugs at the malloc/free layer. They're bugs in the PostgreSQL memory model.
TL;DR —
pg_ext_memcheckruns inside a PostgreSQL backend and watches theMemoryContexttree, shared-memory boundaries, and DSM lifecycle of another extension under test. It catches context leaks, wrong-context allocations, bloat, and shmem overruns — and attributes each finding to the library that caused it. It complements Valgrind; it does not replace it. CI is green on PG 15, 16, 17, and 18. MIT-licensed.
The gap nobody else fills
Valgrind and AddressSanitizer are excellent. If your extension does a use-after-free on a raw malloc'd buffer, or overruns a calloc region, they'll catch it. They've earned their reputation.
But to those tools, a PostgreSQL backend is just another C program that happens to call malloc and free a lot. They have no idea that PostgreSQL layers a MemoryContext abstraction on top of malloc, and that this abstraction has its own correctness rules:
A
palloc()in the wrong context (say,TopMemoryContextinstead of a per-query context) is a permanent leak for the lifetime of the backend process — but every byte of it is a perfectly valid heap allocation. Valgrind is silent.A child
MemoryContextcreated in_PG_initand never deleted accumulates across every query — but again, the heap allocations are valid. Valgrind is silent.An extension writes one byte past its declared
ShmemAlloc()region. The page is still mapped, the write doesn't fault, and the corruption only shows up later when a neighbouring struct gives wrong answers. Valgrind, in most builds, is silent.A
MemoryContextReset()doesn't callfree()on individual allocations — it bulk-resets a block list. A pointer into a reset context is not a use-after-free in themallocsense, but dereferencing it is still a bug. Valgrind is silent.
These are the bugs that cause "weird, hard-to-reproduce" behaviour: session bloat after a few hours, stale-pointer corruption only under concurrent load, OOMs in long-running connections. Every PostgreSQL extension author has seen at least one. None of them are caught by raw-heap tools.
pg_ext_memcheck is built specifically for that class. The intended workflow stays simple:
Valgrind / ASan        →  fix raw heap bugs first
pg_ext_memcheck        →  fix PostgreSQL-semantics bugs second ship
What v0.1.0-beta detects
I want to be precise about what's in the box, because a correctness tool that overstates is worse than useless.
Bug Class | Status |
|---|---|
MemoryContext Leak (new contexts that outlive their query) | ✅ |
Wrong Context Allocation (growth in Top/Cache MemoryContext) | ✅ |
Context Bloat over repeated invocations (linear/superlinear growth) | ✅ |
Shared-memory Boundary overrun (sentinel-byte probe) | ✅ |
DSM Segment Leak | ± |
Use-after-reset (forced reset + re-invoke, crash-safe) | ❌ |
Findings land in a shared-memory ring buffer with severity bands (INFO, WARNING, ERROR), a human-readable detail string, a backend PID, a timestamp — and attribution back to the library that caused them, resolved via dladdr() over the planner/executor hook chain. That attribution is what turns a generic "TopMemoryContext grew by 8 KB" message into something you can actually act on: "…and the library that grew it was my_extension.so."
How it works, briefly
Three pieces, one ring buffer:
Context walker — snapshots the
MemoryContexttree starting atTopMemoryContext, recording(name, depth, parentHash, totalAllocated, totalFree)for every live context. Identity is name-and-depth based (pointers are unstable across runs), so diffs are stable across PostgreSQL versions.Hook layer —
planner_hookandExecutorStart/ExecutorEndhooks bracket a query: before-snapshot at the start, after-snapshot at the end, diff in between. The before-snapshot lives in a dedicated long-livedMemoryContextso its lifetime is independent of whichever transient context the planner happens to be running in.Violation log — a 2048-entry LWLock-guarded ring buffer in shared memory. Queryable from SQL (
ext_memcheck.end()returns the current session's findings;ext_memcheck.flush_violations()drains it into a regular table for persistence).
A shmem sentinel probe plants byte 0xDE just past the declared end of registered segments and verifies it after the workload runs — that's the shmem-overrun detector. DSM segments can be tracked manually via track_dsm_handle() and reported as leaks at session end.
Read More about the project at: Docs
A concrete example
Suppose your extension accidentally does this in an executor hook:
MemoryContextAlloc(TopMemoryContext, 8192); /* whoops */
That's a perfect 8 KB-per-query permanent leak. With pg_ext_memcheck:
CREATE EXTENSION pg_ext_memcheck;             -- requires shared_preload_libraries

SET pg_ext_memcheck.memcheck_mode = 'all';    -- snapshot both planner and executor
SELECT ext_memcheck.begin('');                -- open the test window

SELECT my_extension.do_work('input');
SELECT my_extension.do_work('more_input');

SELECT * FROM ext_memcheck.end();
 check_type      | severity | detail                                                         | source_lib
-----------------+----------+----------------------------------------------------------------+-----------------
 wrong_ctx_alloc | WARNING  | context 'TopMemoryContext' (depth 0): allocated grew by 8192…  | my_extension.so
 wrong_ctx_alloc | WARNING  | context 'TopMemoryContext' (depth 0): allocated grew by 8192…  | my_extension.so
Two findings, one per query, naming the offending context and the library that grew it. That's the entire intended user experience.
Tested against real bugs (positive detection)
A regression suite that only asserts "the call returned without erroring" tells you nothing about whether the tool actually catches the bug it claims to catch. v0.1.0 ships with a deliberately-buggy companion extension — buggy_pg_ext — that leaks 8 KB into TopMemoryContext on every query via its ExecutorStart hook.
The regression test does three things end-to-end:
Loads
buggy_pg_extper session (no global preload — other tests stay clean).Runs two
SELECTqueries.Asserts that
ext_memcheck.end()returns at least onewrong_ctx_allocrow whose detail mentionsTopMemoryContextand whosesource_libcontainsbuggy_pg_ext.
A second test sets allowed_contexts = ['TopMemoryContext'] and asserts the violations vanish — proving the pattern filter actually filters, not that the result was accidental.
That's positive detection: the bug exists, the tool catches it, the tool attributes it, and the filter behaves as documented. CI runs the full suite green on PostgreSQL 15, 16, 17, and 18.
Honest scope — what's not in this beta
Use-after-reset detection is Phase 2. The design calls for a
BackgroundWorkerto run crash-inducing tests in isolation (so a SIGSEGV confirms the bug rather than killing your session). The worker harness is a stub today; the scenariocontext_reset_stormwill land alongside it.DSM auto-tracking is bounded by PostgreSQL itself. There is no
dsm_create_hookordsm_attach_hook, and the per-backenddsm_segmentlist isn't enumerable from public API. So the realistic path for a v0.2 improvement isemit_log_hook— capturing PostgreSQL's own "resource was not closed: dynamic shared memory segment" warnings and folding them into the violation log. That catches the common un-pinned leak case. Pinned-segment leaks remain fundamentally indistinguishable from intentional persistence.Additional scenarios (
concurrent_backends,cursor_leak,oom_simulation,cold_warm_cold) are designed but not implemented.Not safe for production monitoring. Snapshot/diff has measurable per-query overhead. This is a testing tool: explicit
begin(), run your workload,end(), done.
Try it
Requirements: PostgreSQL 15+ with server headers, a C compiler, and pg_config on PATH.
git clone https://github.com/samsiva-dev/pg_ext_memcheck.git
cd pg_ext_memcheck
make
sudo make install
# postgresql.conf
shared_preload_libraries = 'pg_ext_memcheck'
CREATE EXTENSION pg_ext_memcheck;
SELECT ext_memcheck.begin('');
-- exercise your extension
SELECT * FROM ext_memcheck.end();
The four built-in stress scenarios — growth_benchmark, tx_abort_loop, wrong_context_probe, shmem_sentinel_probe — are good first probes if you don't have a target query in mind.
Contributing
If you maintain a PostgreSQL extension and point this at it, I'd genuinely like to know what it finds — true positives and false positives both. The issue tracker is the right place, and there's an open invitation in the README. PRs are welcome too: the Phase 2 BGWorker harness, the emit_log_hook DSM bridge, and the missing stress scenarios are all good first targets.
⭐ Repository: https://github.com/samsiva-dev/pg_ext_memcheck
📜 License: MIT
🏷️ Tag: v0.1.0-beta
Thanks for reading — and if you ship an extension, please run this against it.
Enjoyed this post?
2 reactions